Generating ACI diagrams with acitoolkit
14 Jan 2015 Category:The logical model within a Cisco ACI fabric is a bit different to what most network administrators are familiar with, so it is often useful to visualise what is going on in a diagram. Usually this is done manually on a whiteboard (because all engineers love whiteboards!), however it would be great to generate these diagrams quickly and in an automated way. So I’ve started on a small tool, aci-diagram, written in Python to do just this.
I have chosen to base the tool on the acitoolkit, which (among other things) is intended to present a simplified object model compared to ACI’s underlying rich and complete model (which is also available through the native REST API if needed).
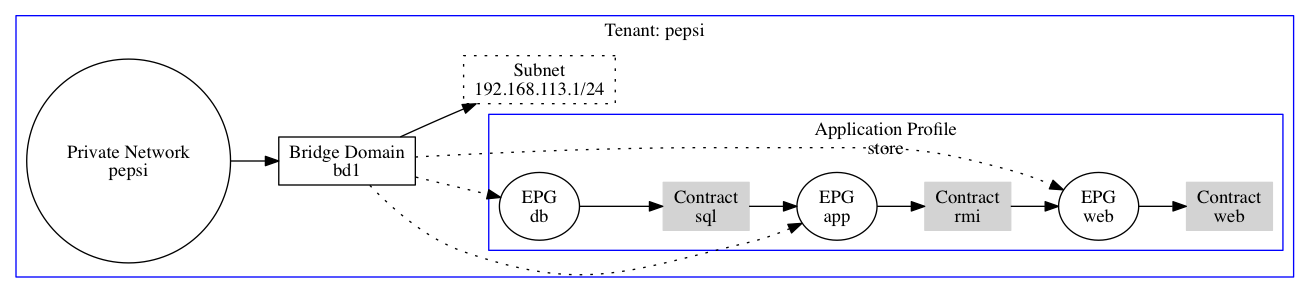
Using the tool is very simple, the login (username), password, URL (for the APIC) and output filename are required. By default it will create a single diagram that includes all of the tenants on the system but, as that could be quite large, you can use the -t option to restrict processing to a subset of tenants. For example, this will generate a diagram for a single tenant called “pepsi”:
./aci-diagram/diagram.py -l admin -p password -u https://10.1.1.1 -t pepsi -o single-tenant.png
Processing tenant pepsi


Drawing graph to single-tenant.png
… and here is the generated diagram:
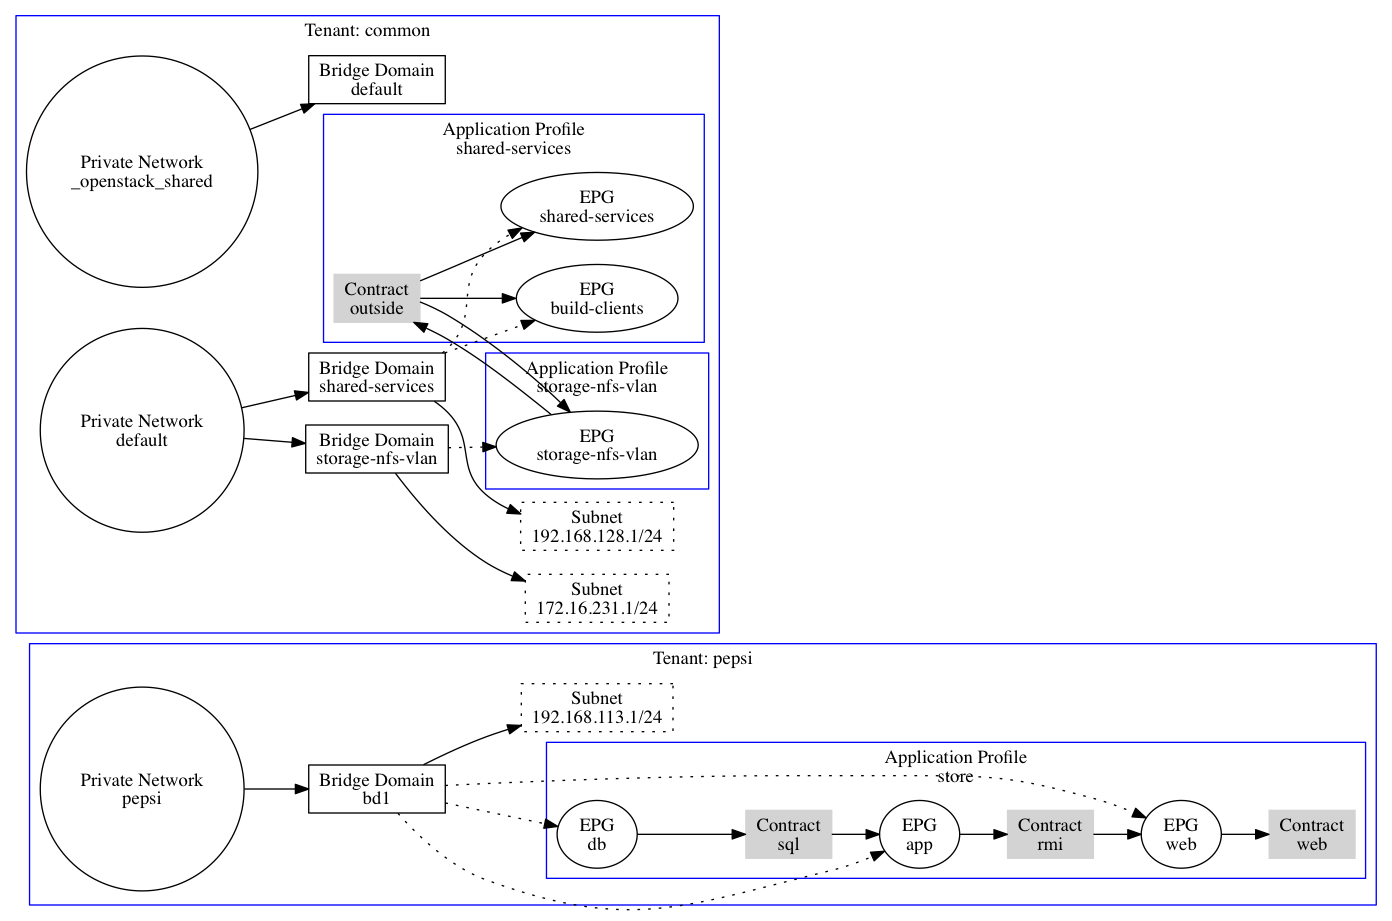
Similarly, diagrams for multiple tenants can be generated:
./aci-diagram/diagram.py -l admin -p password -u https://10.1.1.1 -t pepsi common -o multi-tenant.png
Processing tenant pepsi
Processing tenant common


Drawing graph to multi-tenant.png
… and here is the generated diagram:
#Behind the scenes As mentioned earlier, I am using the acitoolkit for interrogating the ACI system, and the diagrams are based on the toolkit’s simplified object model. At this stage the tool is focused on the application topology related objects in the model:
- Tenant
- Private network
- Bridge domain
- Subnet
- Endpoint Group (EPG)
- Contract
Once the tool has gathered the objects through the toolkit, it traverses through the hierarchy and adds nodes and edges to a GraphViz graph using the pygraphviz Python wrapper, e.g.:
        for epg in app.get_children(only_class=EPG):
            appcluster.add_node(epg_node(tenant, app, epg), label="EPG\n"+epg.name)
Finally, GraphViz is called on to draw the graph into the output file, so any format that your GraphViz installation is compiled with is available, e.g. PNG, JPG or PS.
#Future work There is clearly plenty of scope for future work such as expanding the scope of the object model that is supported to include, for example, physical objects such as interfaces, switches and line cards. Currently there is a limitation which means that relationships across tenants will not be drawn in the graph. It would be good to address this, but I think it will take some work in the acitoolkit itself.
As always, I’m keen to hear your feed back on twitter where I am @chrisgascoigne or you can fork and contribute to the code on GitHub.